YuJa (Faculty) - Content Analytics
This article contains information on how to access and interpret a media's analytics.
Content Analytics provides information about individual media files and user interactions with those files, including an overall summary and specific information about views, browsers, operating systems, and a segment-by-segment breakdown of media content viewing patterns.
NOTE: Analytics can only be reliably recorded on videos watched through a content area in Blackboard using the YuJa Video Quizzes and Analytics tool. Visit this ITS KnowledgeBase article to learn more about deploying a video in Blackboard using this tool.
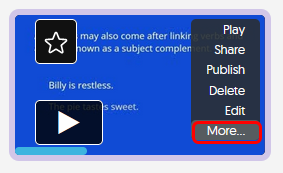
- Navigate to the media thumbnail. Hover your mouse over the thumbnail and click More from the menu.
- From the pop-up window, click on Analytics from the menu.
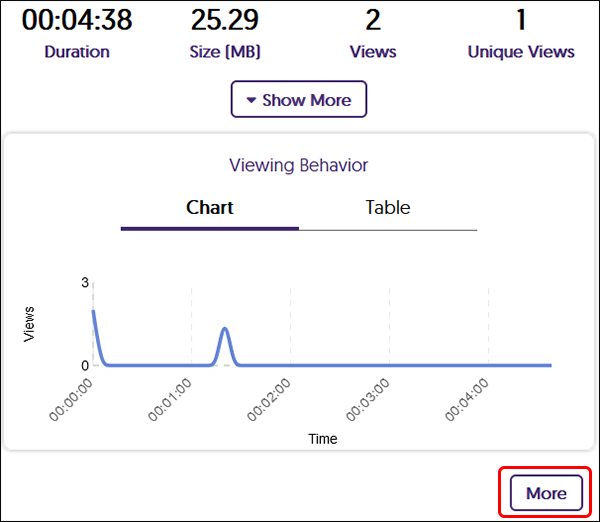
- The Summary page will display an overview of the usage. Click on the More button for a more detailed report.
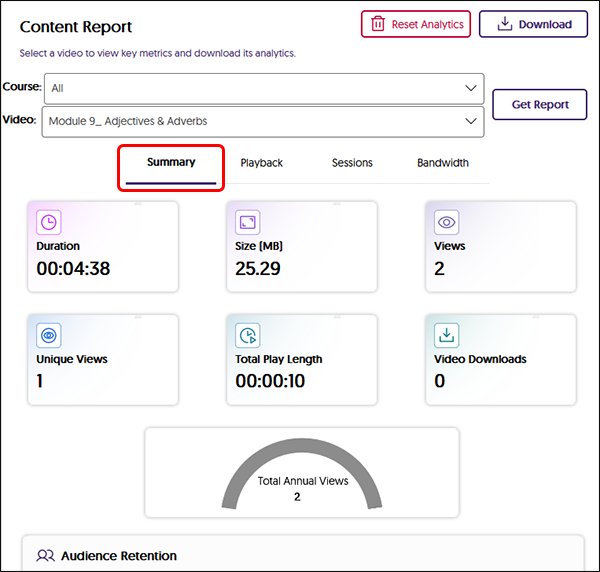
- The Summary tab will display the Viewing Behavior of users and Hot Spots indicate most watched areas. This could be helpful in determining areas that users are revisiting, perhaps because they are not retaining the information.
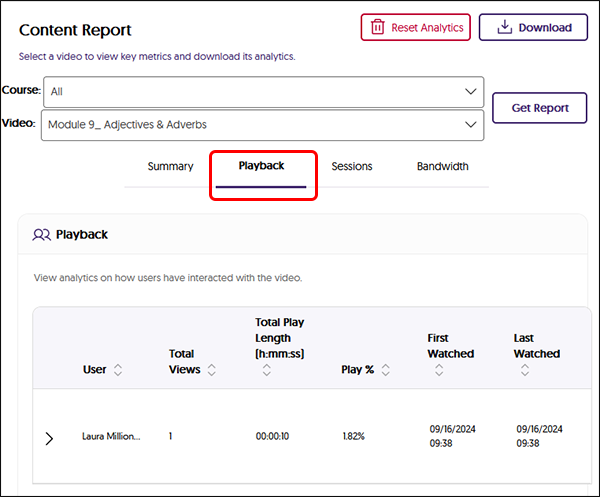
- Click on the Playback tab. Playback lists individual users viewing behavior. Click the View Graph button for a visual display.
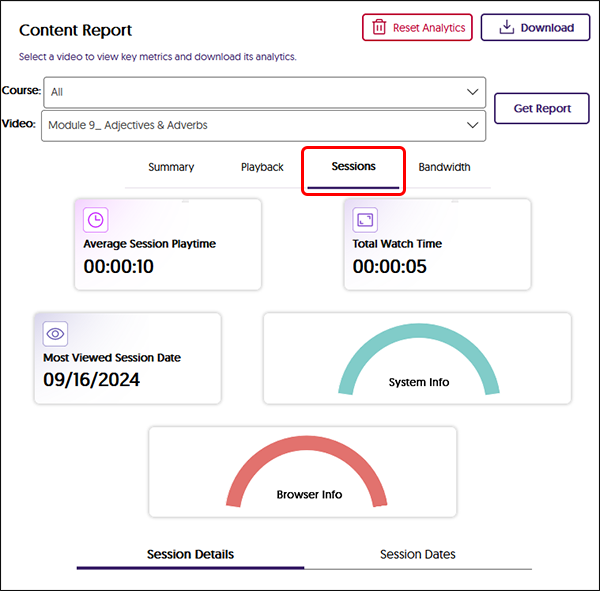
- Click on the Sessions tab. Sessions shows information about an individual viewing session. You may see one or more students viewing the media more than once. This may indicate the student has been watching a longer video in chunks or watching segments more than once.
Use the analytics to improve the users experience and retain ability. If users are repeatedly viewing the same content, reach out to the students for extra guidance. Consider splitting up a longer video if you notice that many students are not completing the video in one sitting.
For more information about Content Analytics, visit the YuJa support page at: https://support.yuja.com/hc/en-us/articles/360043303554-Content-Analytics

